In logistics and last-mile delivery, data is everywhere—but clarity is rare. Teams often track dozens of metrics without a clear understanding of which ones actually drive performance. This leads to dashboards full of numbers but little actionable insight. The reality is simple: you don’t need more data—you need the right data. The right KPIs provide a clear picture of operational efficiency, delivery reliability, and customer satisfaction, enabling teams to make faster and better decisions.
Focusing on a small, high-impact set of delivery KPIs allows businesses to identify inefficiencies, reduce costs, and improve service quality. Instead of reacting to problems after they occur, teams can proactively optimize operations based on real-time insights. The following eight KPIs form a comprehensive framework for managing and scaling delivery operations effectively.
Key Delivery KPIs You Should Track
Each of the following KPIs represents a critical dimension of delivery performance. Together, they provide a balanced view of cost, efficiency, reliability, and customer experience.
- Cost per delivery: Measures total operational cost divided by completed deliveries. This KPI helps identify cost inefficiencies and optimize resource allocation.
- On-time delivery rate: Tracks the percentage of deliveries completed within the promised time window, directly impacting customer satisfaction and trust.
- First-attempt success rate: Indicates how many deliveries are completed successfully on the first attempt, reducing re-delivery costs and operational friction.
- Stops per driver: Measures the number of deliveries completed by each driver per day, reflecting productivity and route efficiency.
- Distance per delivery: Calculates the average distance traveled per order, helping optimize routing and reduce fuel costs.
- POD (Proof of Delivery) capture rate: Tracks the percentage of deliveries with verified proof such as photos or signatures, ensuring accountability and reducing disputes.
- Customer satisfaction score: Based on ratings and feedback, this KPI reflects the overall delivery experience from the customer’s perspective.
- Driver utilization: Measures productive time versus idle time, helping improve workforce efficiency and capacity planning.
Cost per delivery
- Tells you about
- Margin health
- Watch for
- Upward drift
On-time rate
- Tells you about
- Reliability
- Watch for
- Falling below SLA
First-attempt success
- Tells you about
- Process quality
- Watch for
- Clustered failures
Stops per driver
- Tells you about
- Productivity
- Watch for
- Low vs route potential
Distance per delivery
- Tells you about
- Routing efficiency
- Watch for
- Excess miles
POD capture rate
- Tells you about
- Accountability
- Watch for
- Gaps in proof
CSAT
- Tells you about
- Experience
- Watch for
- Negative trend
Driver utilization
- Tells you about
- Labor efficiency
- Watch for
- High idle time
| KPI | Tells you about | Watch for |
|---|---|---|
| Cost per delivery | Margin health | Upward drift |
| On-time rate | Reliability | Falling below SLA |
| First-attempt success | Process quality | Clustered failures |
| Stops per driver | Productivity | Low vs route potential |
| Distance per delivery | Routing efficiency | Excess miles |
| POD capture rate | Accountability | Gaps in proof |
| CSAT | Experience | Negative trend |
| Driver utilization | Labor efficiency | High idle time |
Read KPIs in pairs, not isolation
Push stops per driver too hard and on-time rate can slip; cut cost per delivery too aggressively and first-attempt success can suffer. Always check the trade-off metric before celebrating a win.
Why These KPIs Matter for Logistics Performance
Each KPI plays a specific role, but their real value comes from how they work together. For example, improving stops per driver may increase efficiency, but if it negatively impacts on-time delivery rate, the overall customer experience suffers. Similarly, reducing cost per delivery should not come at the expense of service reliability.
- Identify inefficiencies across routing, dispatch, and execution.
- Reduce operational costs by optimizing resource utilization.
- Improve delivery reliability and SLA adherence.
- Enhance customer experience through better communication and performance.
- Enable data-driven decisions instead of reactive problem-solving.
By tracking these KPIs together, businesses can maintain a balance between cost, efficiency, and service quality—something that isolated metrics cannot achieve.
"Tracking a focused set of KPIs helped us quickly identify bottlenecks and significantly improve delivery performance within weeks."
— Head of Operations, Last-Mile Fleet
Turning KPIs Into ROI
ROI in delivery operations depends on cost efficiency, delivery speed, resource utilization, and customer satisfaction, and on how those factors interact. Without analytics, inefficiencies in routing and dispatch stay hidden, cost-saving opportunities are missed, and improvements cannot be measured or validated. Mapping each KPI to the business lever it moves is what turns a dashboard into a return you can point to.
Cost per delivery
- Primary ROI lever
- Margin
- Act when
- Trending up vs baseline
On-time rate
- Primary ROI lever
- Retention
- Act when
- Below your SLA target
Average delivery time
- Primary ROI lever
- Throughput
- Act when
- Slower than zone norm
Driver utilization
- Primary ROI lever
- Labor cost
- Act when
- Idle time is high
First-attempt success
- Primary ROI lever
- Re-delivery cost
- Act when
- Failures cluster by area
| Metric | Primary ROI lever | Act when |
|---|---|---|
| Cost per delivery | Margin | Trending up vs baseline |
| On-time rate | Retention | Below your SLA target |
| Average delivery time | Throughput | Slower than zone norm |
| Driver utilization | Labor cost | Idle time is high |
| First-attempt success | Re-delivery cost | Failures cluster by area |
Plan vs actual is where the money hides
The fastest ROI usually comes from comparing planned routes against what actually happened. Persistent gaps reveal traffic patterns, optimistic time windows, or driver behavior you can fix immediately.
Once you know which lever a KPI moves, use delivery analytics to find the specific fix:
- Compare planned routes with actual execution to identify inefficiencies and reduce unnecessary travel.
- Analyze delays by driver, time of day, or region to pinpoint recurring issues.
- Optimize route planning and resource allocation based on performance data.
- Use historical trends to forecast demand and improve capacity planning.
- Use the data to support strategic decisions such as hiring, expansion, or process changes.
Measuring the Return
Record a baseline for each KPI before you change anything, then track cost savings, efficiency gains, and on-time and first-attempt improvements against it. Quick wins such as cutting redundant travel or rebalancing driver loads tend to show first; gains in reliability compound more slowly. Repeating the cycle creates a feedback loop where data informs decisions and decisions improve performance.
How to Use Delivery KPIs Effectively
Tracking KPIs is only the first step. The real value comes from how consistently and effectively teams use this data to improve operations. Without structured processes, even the best metrics fail to deliver impact.
- Review KPI performance regularly—daily for operations and weekly for strategic insights.
- Set thresholds and alerts for critical metrics such as delays or low success rates.
- Analyze trends across hubs, drivers, time periods, and delivery types.
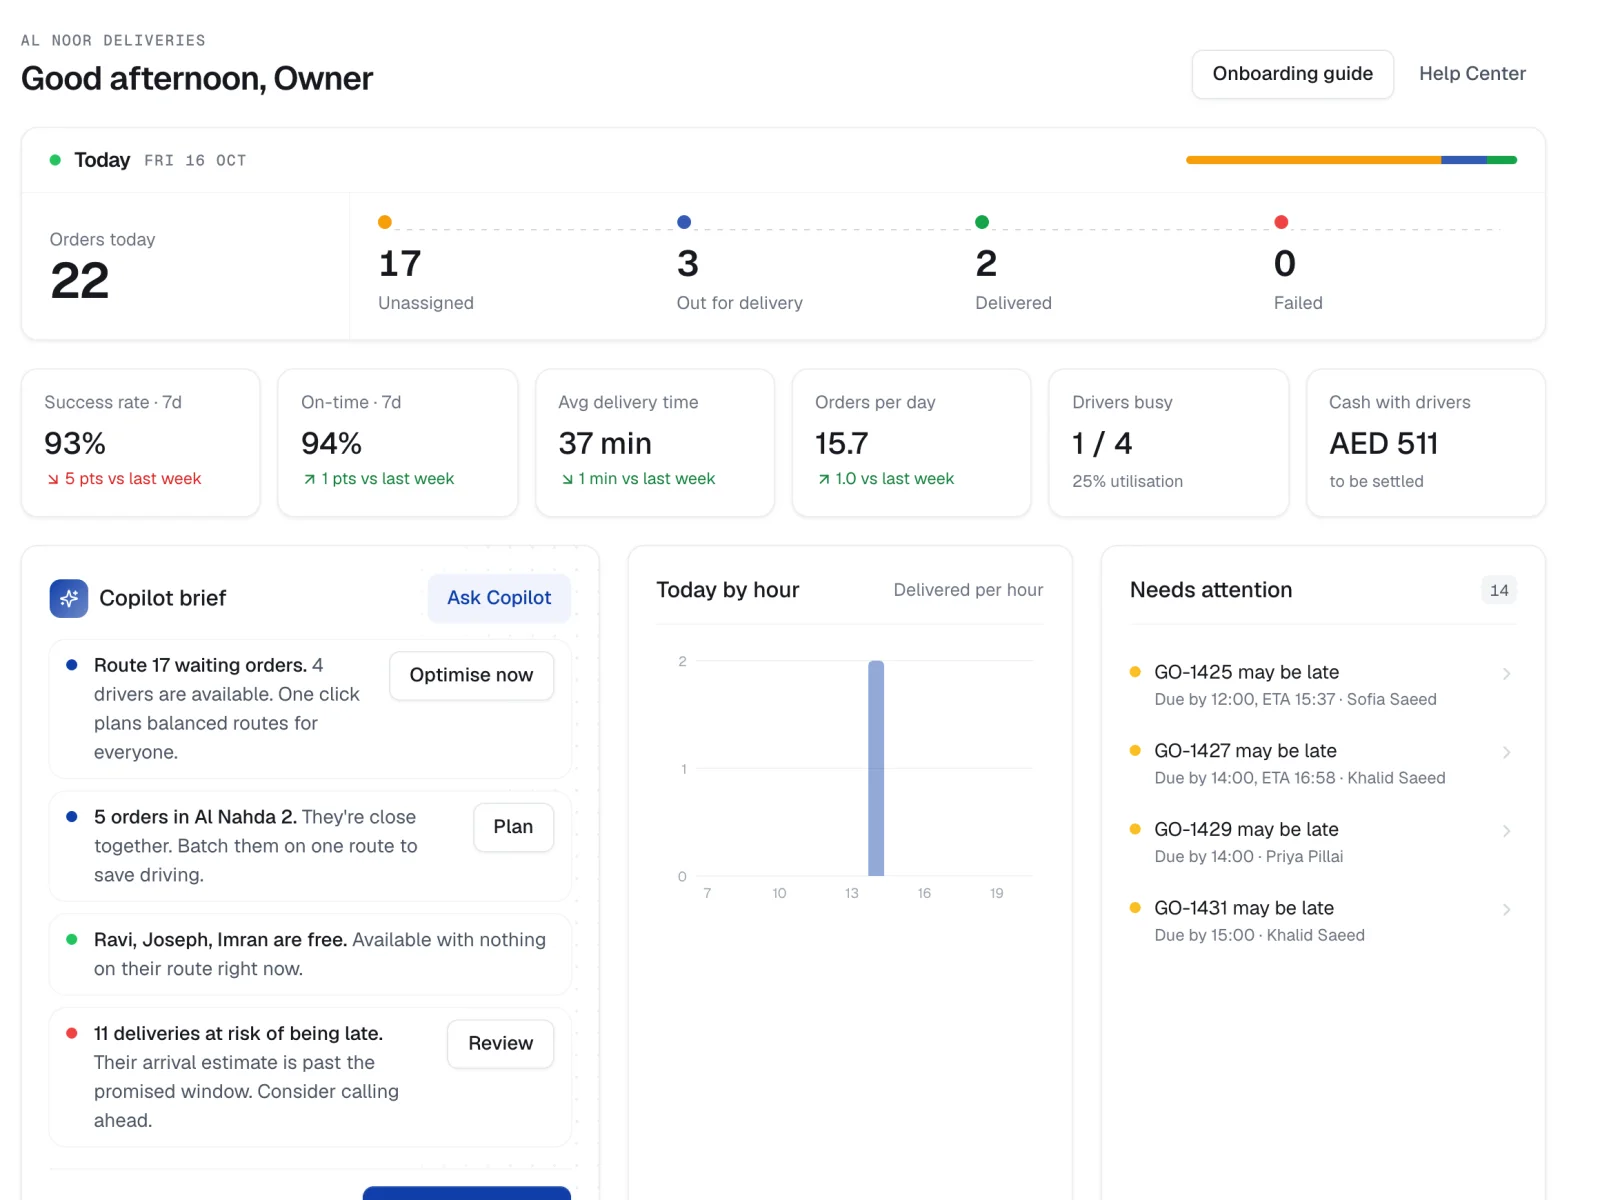
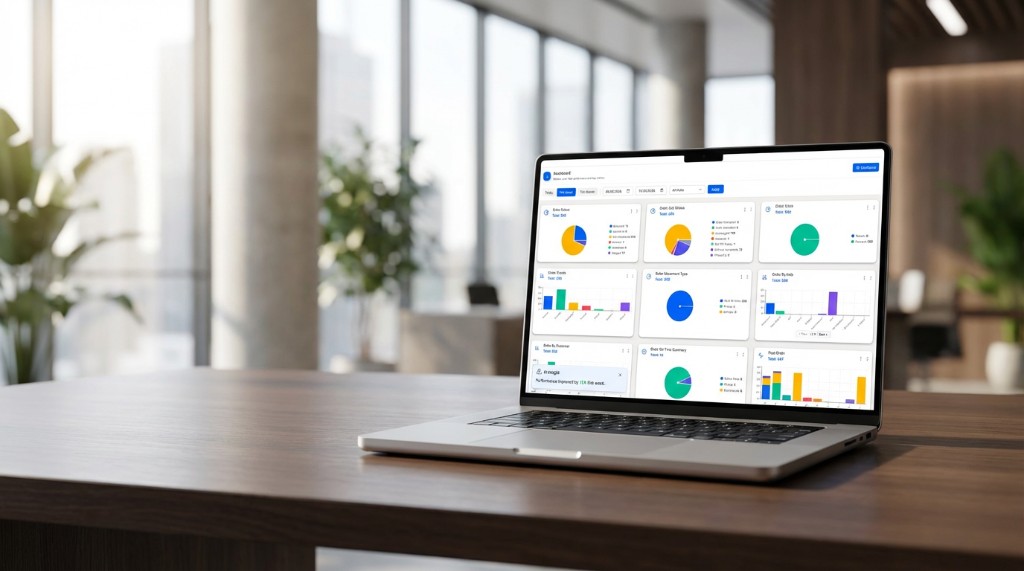
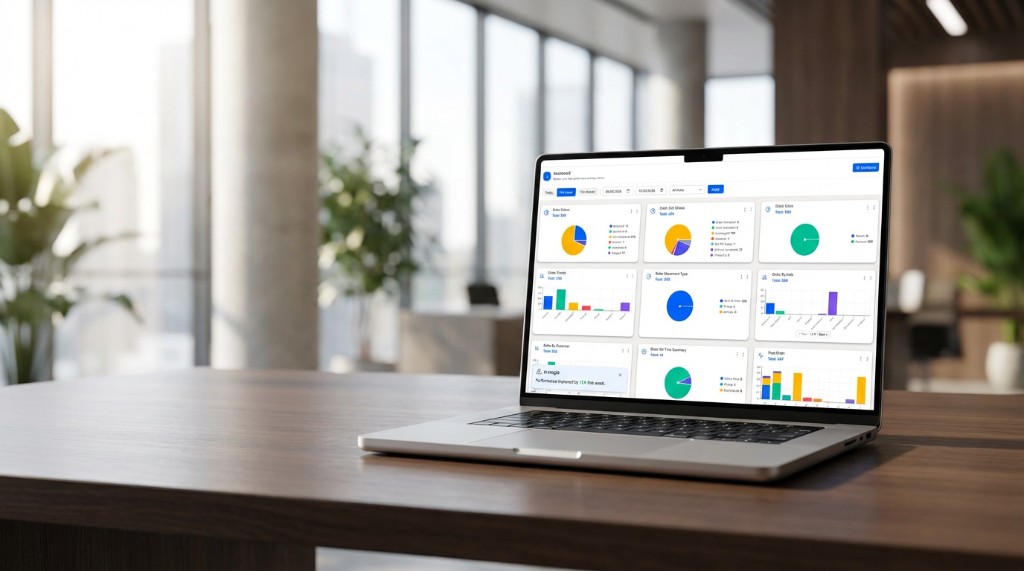
- Use dashboards and analytics tools to visualize data and uncover patterns, and integrate with BI tools for deeper reporting.
- Keep dashboards focused on decision-driving metrics; a sprawling dashboard no one acts on adds noise, not insight.
- Take immediate action on insights rather than waiting for periodic reviews.
Consistency is key. Teams that regularly monitor and act on KPI data can continuously improve performance, while those that track metrics passively often miss opportunities for optimization.
Final Thoughts: Focus on What Drives Impact
In delivery operations, success is not about tracking more metrics—it is about tracking the right ones. The eight KPIs outlined above provide a clear and actionable framework for improving efficiency, reducing costs, and enhancing customer satisfaction.
By focusing on these metrics and embedding them into daily operations, businesses can move from reactive management to proactive optimization. When analytics becomes a core part of decision-making, ROI stops being hard to measure: it becomes a natural outcome of better operations, more reliable deliveries, and sustainable growth.
Related reading
Frequently asked questions
Which delivery KPIs matter most?
Focus on cost per delivery, on-time delivery rate, first-attempt success rate, stops per driver, distance per delivery, proof-of-delivery capture rate, customer satisfaction score, and driver utilization.
Why not track as many metrics as possible?
Tracking too many KPIs creates noise and dashboards full of numbers but little insight. A focused set of high-impact metrics makes it easier to identify problems and act quickly.
How often should I review delivery KPIs?
Review operational metrics daily and strategic trends weekly, set alerts for critical thresholds like delays or low success rates, and act on insights immediately rather than waiting for periodic reviews.
Why should KPIs be analyzed together?
Metrics interact. Improving stops per driver may hurt on-time rate, and cutting cost per delivery can reduce reliability. Viewing KPIs together keeps cost, efficiency, and service quality balanced.
Which KPI should I fix first?
Start with the metric most misaligned with your goals and most tied to cost or churn, often first-attempt success or on-time rate. Fixing a single high-leverage KPI usually lifts several others.
How do I set targets for each KPI?
Use your own historical baseline as the starting point, then benchmark against your SLAs and sector norms. Targets should be ambitious but achievable so teams act on them rather than ignore them.
How does delivery analytics reduce costs?
By comparing planned routes with actual execution and analyzing delays by driver, time, and region, analytics surfaces inefficiencies such as excess miles, idle time, and failed attempts, so you can fix routing and resource allocation.
How can I measure ROI from delivery analytics?
Record a baseline for your core KPIs before you make changes, then track cost savings, efficiency gains, and improvements in on-time and first-attempt rates over time. With the right KPIs, ROI becomes a measurable outcome rather than an estimate.
How quickly can analytics show ROI?
Quick wins like cutting redundant travel or rebalancing driver loads often show up within the first few weeks. Compounding gains in on-time and first-attempt rates build over the following months.