Turn delivery data into actionable intelligence
AI-powered dashboards that surface hidden inefficiencies, predict demand, and recommend operational improvements — transforming raw data into decisions.
See it in action
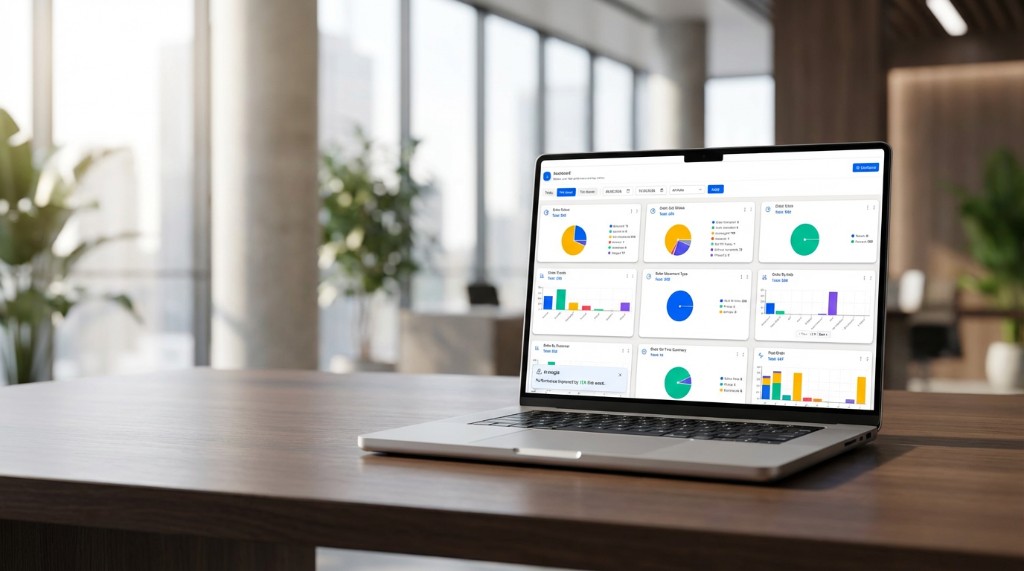
Reports & Analytics — fleet performance, order status, trends & hub analytics
How it works
Simple to set up, powerful in action
Data flows in
Every order, route, driver action, and customer interaction is automatically captured.
AI analyzes patterns
Machine learning surfaces trends, anomalies, and optimization opportunities.
Get recommendations
AI delivers actionable insights — what to fix, where to invest, and what to automate.
Everything reports & analytics offers
Real-time dashboards
Live operational views showing deliveries, drivers, costs, and customer metrics.
AI anomaly detection
Automatically flags unusual patterns — late deliveries, cost spikes, driver issues.
Demand forecasting
Predict order volumes by time, day, and location to optimize staffing.
Driver scorecards
Performance metrics per driver — on-time rate, ratings, speed, and efficiency.
Cost analytics
Cost-per-delivery, cost-per-mile, and carrier cost comparisons.
Delivery heat maps
Visualize delivery density and identify high-demand zones.
Scheduled reports
Auto-generate and email daily, weekly, or monthly reports to stakeholders.
Data export API
Pull data into your BI tools — Tableau, Power BI, Looker, or custom dashboards.
Measurable impact
Real results from real customers
AI surfaces inefficiencies that manual analysis misses.
Real-time data replaces weekly spreadsheet reviews.
ML-powered demand predictions to optimize driver allocation.
Works with your stack
Connects with 50+ platforms out of the box
Frequently asked questions
How often is data refreshed?
Dashboards update in real-time. Historical reports are available from your first day on the platform.
Can I build custom reports?
Yes. Use our report builder to create custom views, or export data to your preferred BI tool via API.
Is historical data available?
All data is retained for the life of your account. Enterprise plans offer up to 7 years of historical data.
Ready to try Reports & Analytics?
Get started in minutes. No credit card required.