For most of the last decade, sustainability reporting in logistics lived in a separate spreadsheet—updated quarterly by someone in finance, rarely seen by planners, and almost never connected to the routing decisions made at 6am every morning. That separation is ending fast.
Why logistics sustainability has become a commercial requirement
Large shippers and retailers are now requiring carriers and 3PLs to provide emissions data tied to real operations. Scope 3 reporting under the GHG Protocol requires companies to account for the emissions of their logistics partners—which means your customers' sustainability targets are becoming your operational constraints. In the European Union, the Corporate Sustainability Reporting Directive (CSRD) extends mandatory emissions disclosure to thousands of mid-market companies. The era of sustainability as a side exercise is over.
- 24% of global CO₂ emissions come from the transport sector (IEA; industry summaries such as DHL Freight Connections, 2025).
- 30–50% of logistics-chain CO₂ can come from last-mile delivery alone (industry reporting and academic research—e.g. MIT-aligned supply-chain studies, 2025).
- US last-mile e-commerce delivery has been estimated at tens of millions of tonnes CO₂ annually; failed first attempts and re-deliveries add avoidable kilometres at scale.
The numbers make clear why last-mile is the right place to focus. While long-haul freight and warehousing contribute meaningfully to total logistics emissions, the final delivery leg is disproportionately carbon-intensive relative to its distance—driven by low load factors, frequent stops, idling in urban traffic, and a high rate of failed first-attempt deliveries. Each re-attempt adds unnecessary CO₂ per package; at fleet scale, that shows up as millions of avoidable tonnes.
Measuring what actually matters — and what does not
Before implementing any sustainability programme, logistics teams need to be precise about what they are measuring—and honest about what they cannot. GPS and real-time traffic data introduce noise that makes short-term CO₂ figures unreliable as a basis for daily routing decisions. Chasing false precision in absolute emissions numbers leads to gaming the metric rather than improving the outcome.
The right metrics: intensity over absolute volume
The most operationally useful sustainability metrics for last-mile logistics are intensity-based: CO₂e per delivery, CO₂e per tonne-kilometre, or litres of fuel per stop. They normalise for volume—a week with 20% more orders will show higher absolute emissions but may still represent improved carbon efficiency per delivery. Intensity metrics tell you whether your operation is getting cleaner or dirtier relative to the work it is doing.
- CO₂e per stop or per delivery—the most granular, actionable intensity metric for last-mile operations.
- CO₂e per tonne-kilometre—the standard Scope 3 reporting unit for freight under the GHG Protocol.
- Fuel litres per route—a reliable proxy for emissions when telematics is live but full CO₂ modelling is not.
- Empty-mile percentage—a leading indicator of carbon inefficiency; high empty miles signal planning gaps before they show up in emissions totals.
- First-attempt delivery success—each failed attempt adds unnecessary vehicle kilometres.
Use rolling baselines, not point-in-time comparisons
Seasonal volume swings are the single biggest distortion in logistics sustainability reporting. A December peak will show higher absolute emissions than a September baseline—not because your operation became dirtier, but because you delivered more. Rolling monthly or quarterly baselines, tracked as intensity metrics, give planners a truthful view of performance trends without volume masking the signal.
"Industry guidance consistently recommends comparing intensity metrics (CO₂e per stop or per tonne-km) against rolling baselines rather than year-over-year absolute totals alone. That approach is more accurate for internal decision-making and more defensible for Scope 3 and CSRD reporting."
What AI route optimization actually does to emissions
Route optimization has always reduced fuel consumption—that is not new. What has changed is the magnitude of improvement available through AI-driven methods versus traditional shortest-path algorithms, and the volume of peer-reviewed research that now quantifies it.
A 2025 peer-reviewed study in the International Journal of Science and Research Archive compared several AI optimization approaches to conventional routing baselines across logistics networks. Reported emission reductions versus baseline included:
- Ant colony optimization: about 16.2% lower emissions.
- Neural network models: about 20.5% lower emissions.
- Hybrid genetic algorithms: about 23.0% lower emissions.
Ant colony optimization
- Reported emission reduction
- ~16.2%
- Notes
- Strong on dense urban stop clusters
Neural network models
- Reported emission reduction
- ~20.5%
- Notes
- Improves as it learns operational patterns
Hybrid genetic algorithms
- Reported emission reduction
- ~23.0%
- Notes
- Highest reduction in the study setup
Typical first-90-day field result
- Reported emission reduction
- ~10–15%
- Notes
- Before models fully tune to the network
| Approach | Reported emission reduction | Notes |
|---|---|---|
| Ant colony optimization | ~16.2% | Strong on dense urban stop clusters |
| Neural network models | ~20.5% | Improves as it learns operational patterns |
| Hybrid genetic algorithms | ~23.0% | Highest reduction in the study setup |
| Typical first-90-day field result | ~10–15% | Before models fully tune to the network |
Those results were achieved without increasing delivery time or cost in the study setup—consistent with multi-objective engines that minimise idle time, backtracking, and empty repositioning while respecting windows and capacity. Fleet operators deploying AI routing tools often report roughly 10–15% fuel savings within the first 90 days, with some programmes reaching 20–25% as models learn operational patterns.
Emissions cut without slower deliveries
Peer-reviewed work reports 16–23% lower emissions versus conventional routing baselines — achieved in the study setup without increasing delivery time or cost. Every kilometre removed is carbon avoided and money saved.
McKinsey and World Economic Forum analyses have warned that without optimisation, urban delivery emissions could rise materially as e-commerce grows—making proactive routing and dispatch investment a hedge against future regulatory and fuel-cost risk. Every kilometre removed from a plan is both carbon avoided and money saved.
Setting routing guardrails that protect SLAs
The most common objection to sustainability-driven routing changes is the risk of compromising delivery performance. That is legitimate—poorly implemented carbon constraints can increase travel time, breach SLAs, and erode service quality. The answer is guardrails, not blanket “green routes” for every order.
How guardrails work in practice
Rather than applying one sustainability objective everywhere, guardrail-based routing treats carbon as a secondary objective—weighted and constrained, but subordinate to service commitments. The system optimises for minimum emissions within the bounds of what you promised customers.
- Cap additional time per stop for greener variants (for example, no more than a few minutes) so sustainability gains do not become service failures.
- Exempt time-sensitive or SLA-critical flows—pharma cold chain, QSR, same-day windows—from carbon constraints entirely.
- Apply sustainability weighting where minor time variation is acceptable; that is usually where most emission reductions hide.
- Monitor SLA compliance and carbon intensity together—if on-time performance drops below threshold, automatically relax carbon constraints until service recovers.
The idle-time problem
Idle time is an under-appreciated emissions driver: engines running at signals, in queues, or waiting to unload. Research commonly attributes on the order of 15–20% of urban delivery fuel use to idling. Dispatch systems that monitor live vehicle status and route around chronic idling hotspots can unlock reductions no static plan achieves. Cutting idle time by even 10% across a mid-sized fleet removes several tonnes of CO₂e annually—without changing customer windows.
Aligning sustainability with operations: what the dashboard should show
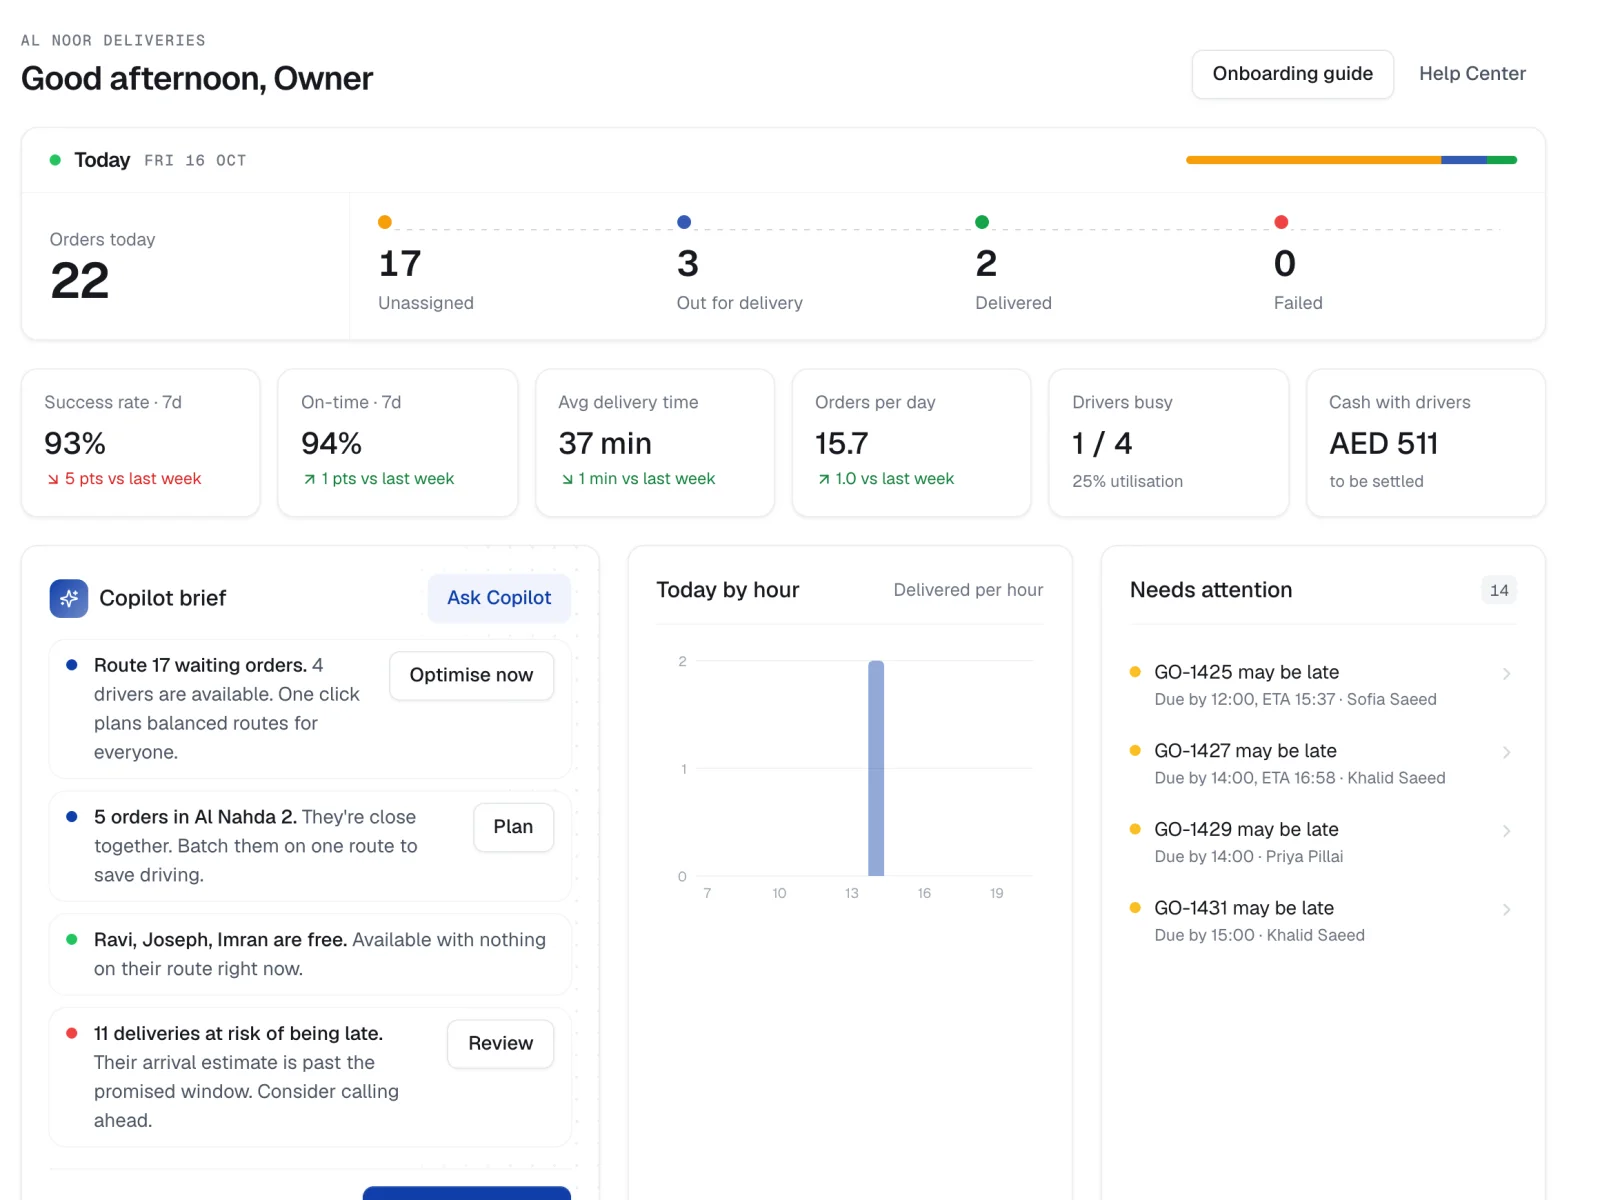
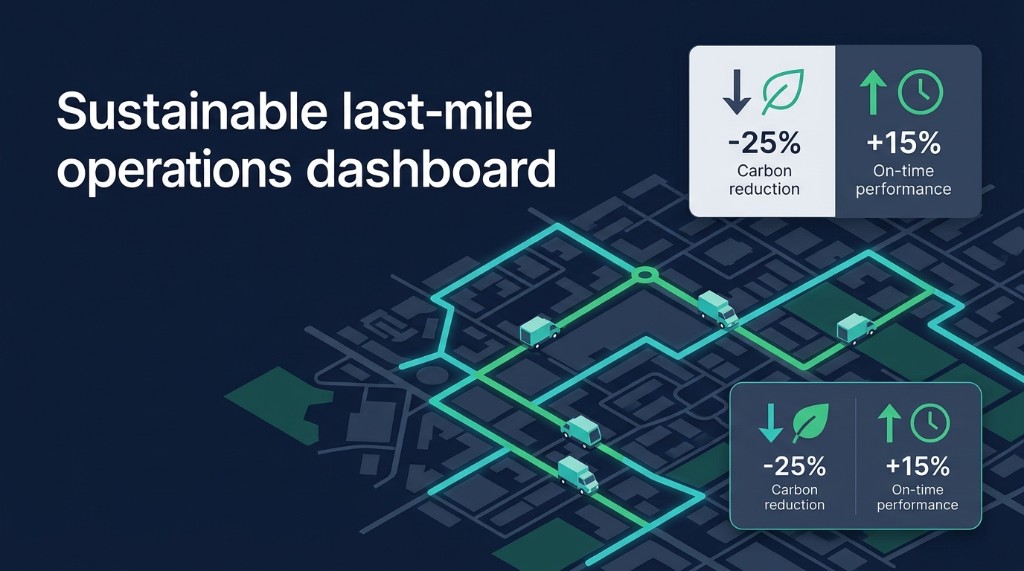
The biggest operational change is simple: sustainability metrics must appear on the same screen as service metrics. When carbon intensity lives only in a quarterly PDF planners never open, it cannot influence the decisions that actually drive emissions. When CO₂e per stop sits next to on-time rate and cost per drop in the dispatch or command-centre UI, it becomes a lever.
- CO₂e per delivery paired with on-time rate—trade-offs visible where routing decisions are made.
- Carbon intensity next to cost per route; carbon “wins” that explode labour or overtime rarely survive budget review.
- Emissions trends tied to utilisation, empty-mile %, and idling minutes already in telematics—avoid siloed sustainability reporting.
- CO₂ as a routing constraint or weighted objective, not only a finance metric.
- Rolling quarterly baselines so seasonal volume does not masquerade as structural performance.
Effective sustainability strategies balance environmental impact with service reliability and cost efficiency. When metrics are shared with routing teams, sustainability stops being a reporting exercise and becomes fewer kilometres, lower fuel spend, and more predictable delivery performance.
Related reading
Frequently asked questions
How much can AI route optimization reduce logistics CO₂ emissions?
Peer-reviewed work comparing AI optimization approaches to conventional baselines has reported roughly 16–23% lower emissions in study conditions. Fleet operators often see about 10–15% fuel savings in the first 90 days after go-live, with further gains as models learn patterns. Actual results depend on baseline efficiency, fleet mix, and stop density.
What is Scope 3 reporting and why does it matter for logistics operators?
Scope 3 covers indirect emissions across the value chain—including outsourced logistics. As large shippers face Scope 3 disclosure, they increasingly require carriers and 3PLs for emissions tied to real deliveries. Carbon tracking becomes a commercial expectation, not a voluntary initiative alone.
Can sustainability routing changes break SLA performance?
They can if carbon is applied bluntly. Use guardrails: treat emissions as a secondary objective inside service bounds, exempt pharmaceutical, QSR, and same-day flows where needed, and relax constraints automatically if on-time performance falls below threshold.
What is the best carbon metric for last-mile operations?
CO₂e per delivery (or per stop) is the most actionable metric for planners because it maps to routes and normalises for volume. CO₂e per tonne-kilometre is the standard unit for many Scope 3 reports. Using both—intensity for operations, tonne-km for external reporting—keeps internal and external views consistent.
How does Geofleet support sustainability goals in logistics?
Geofleet’s AI Command Centre treats routing as a multi-objective problem—balancing time, cost, carrier performance, and carbon intensity. Sustainability can be configured as guardrails so emissions reduction does not compromise SLA commitments, with intensity surfaced next to on-time and cost-per-drop data for planners.